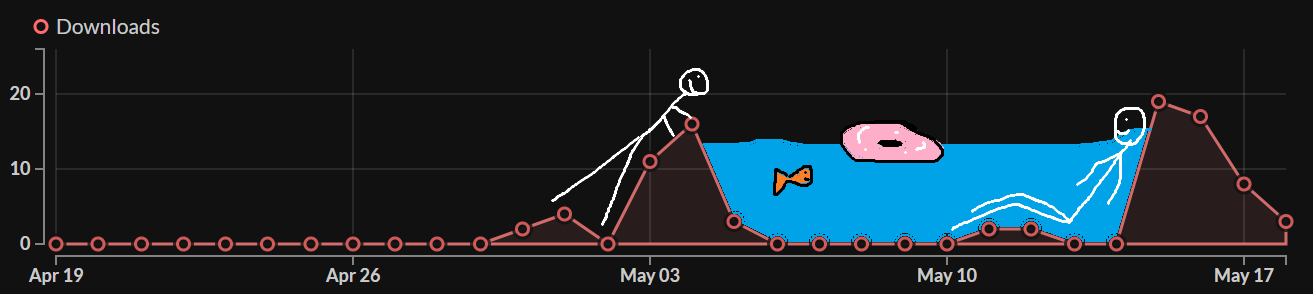
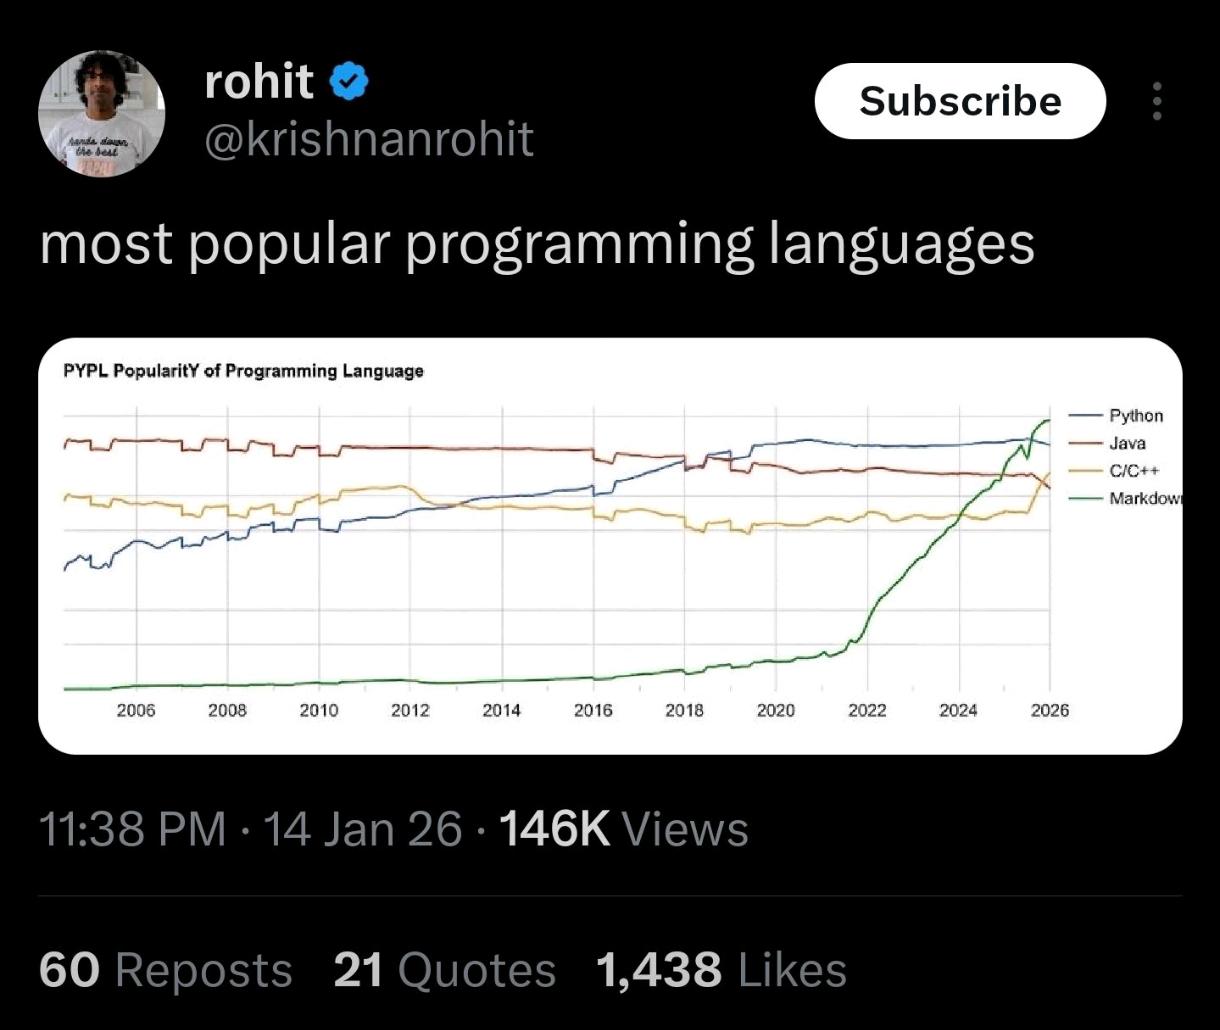
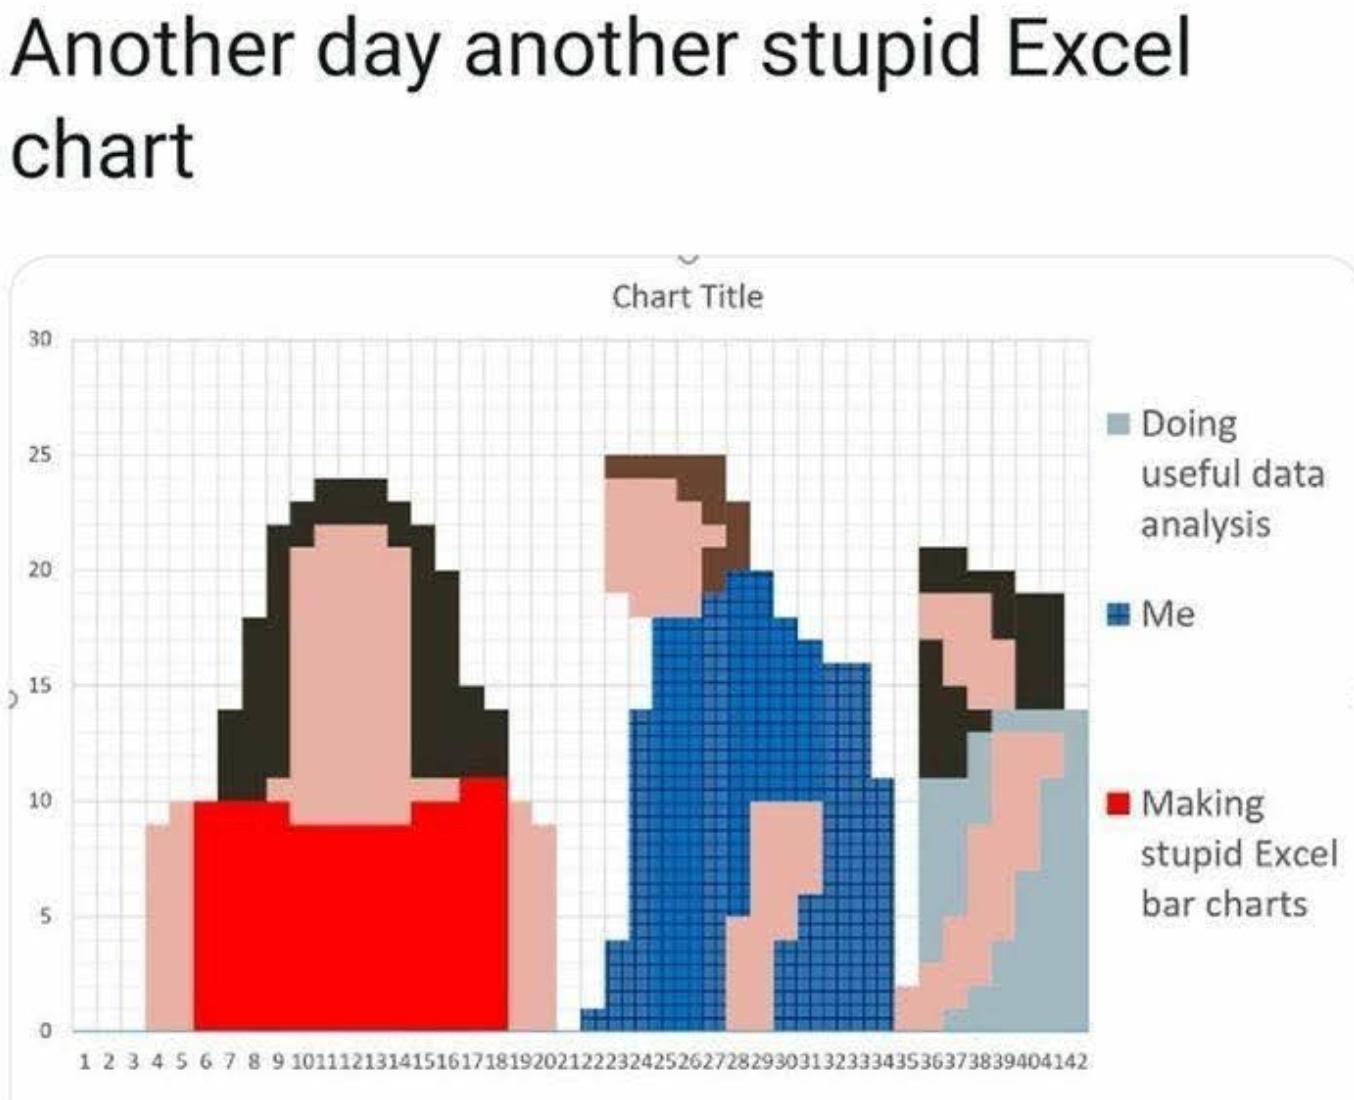
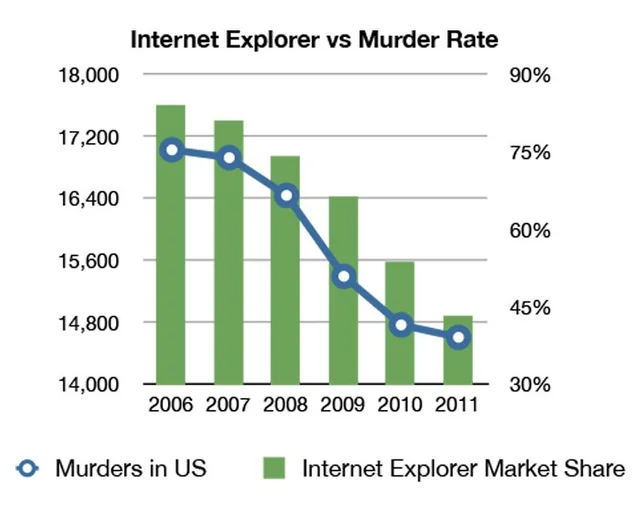
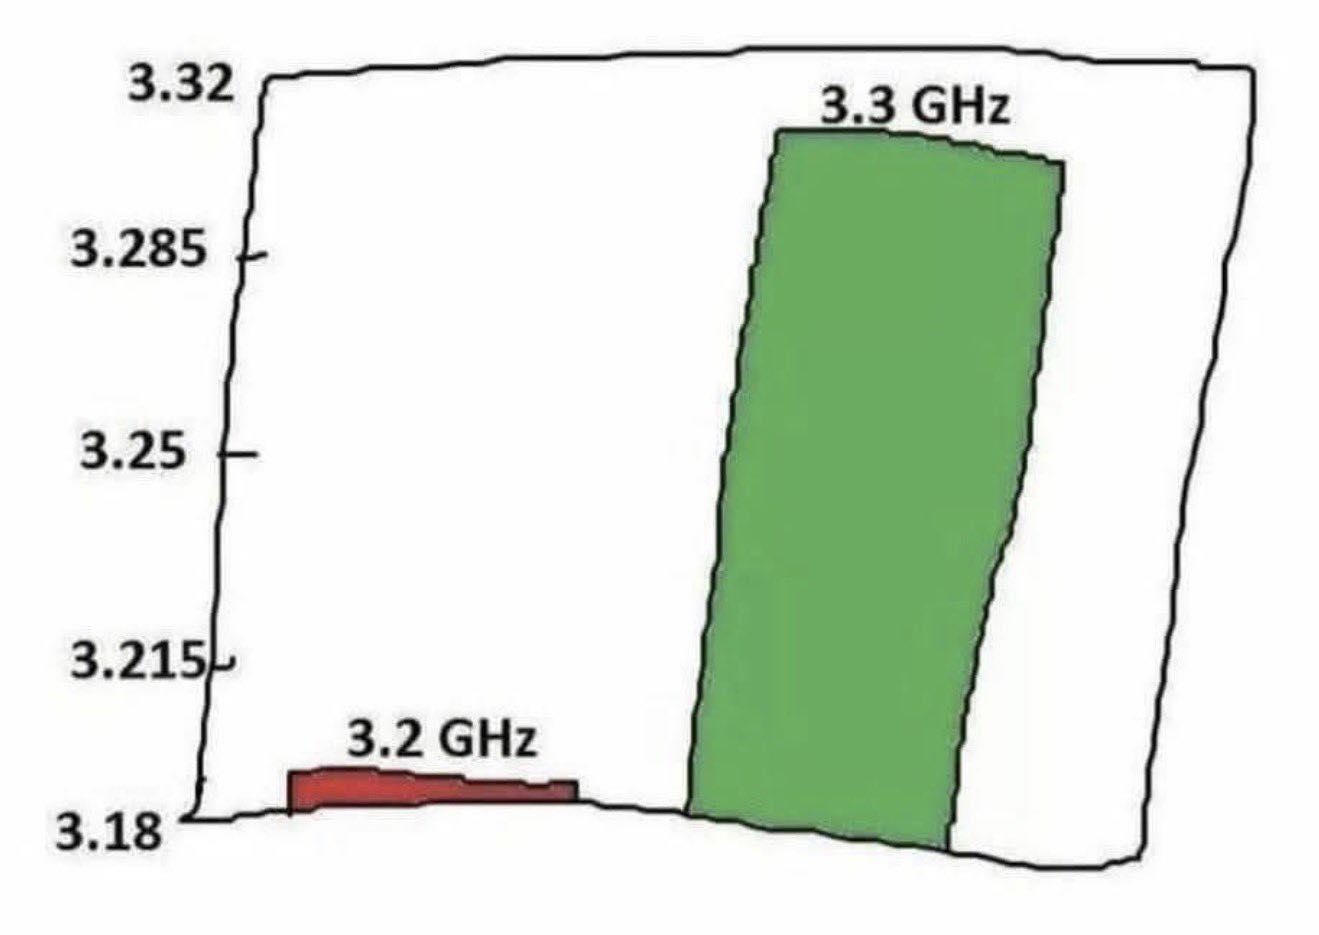
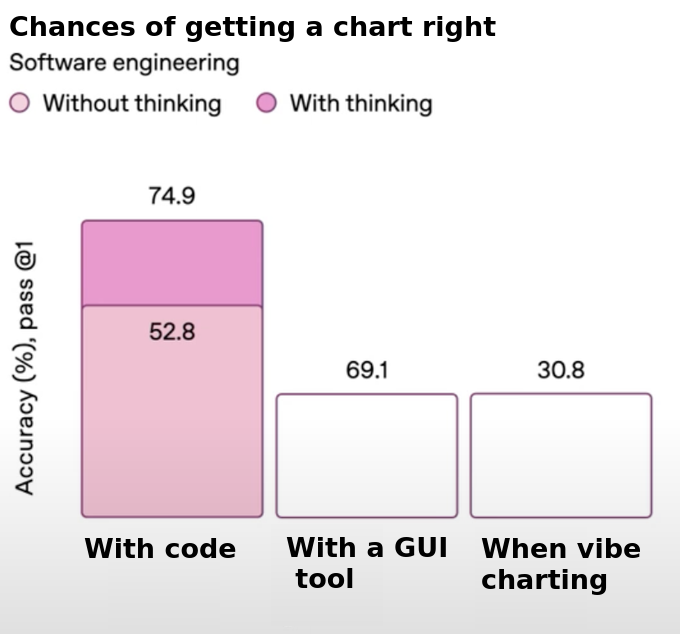
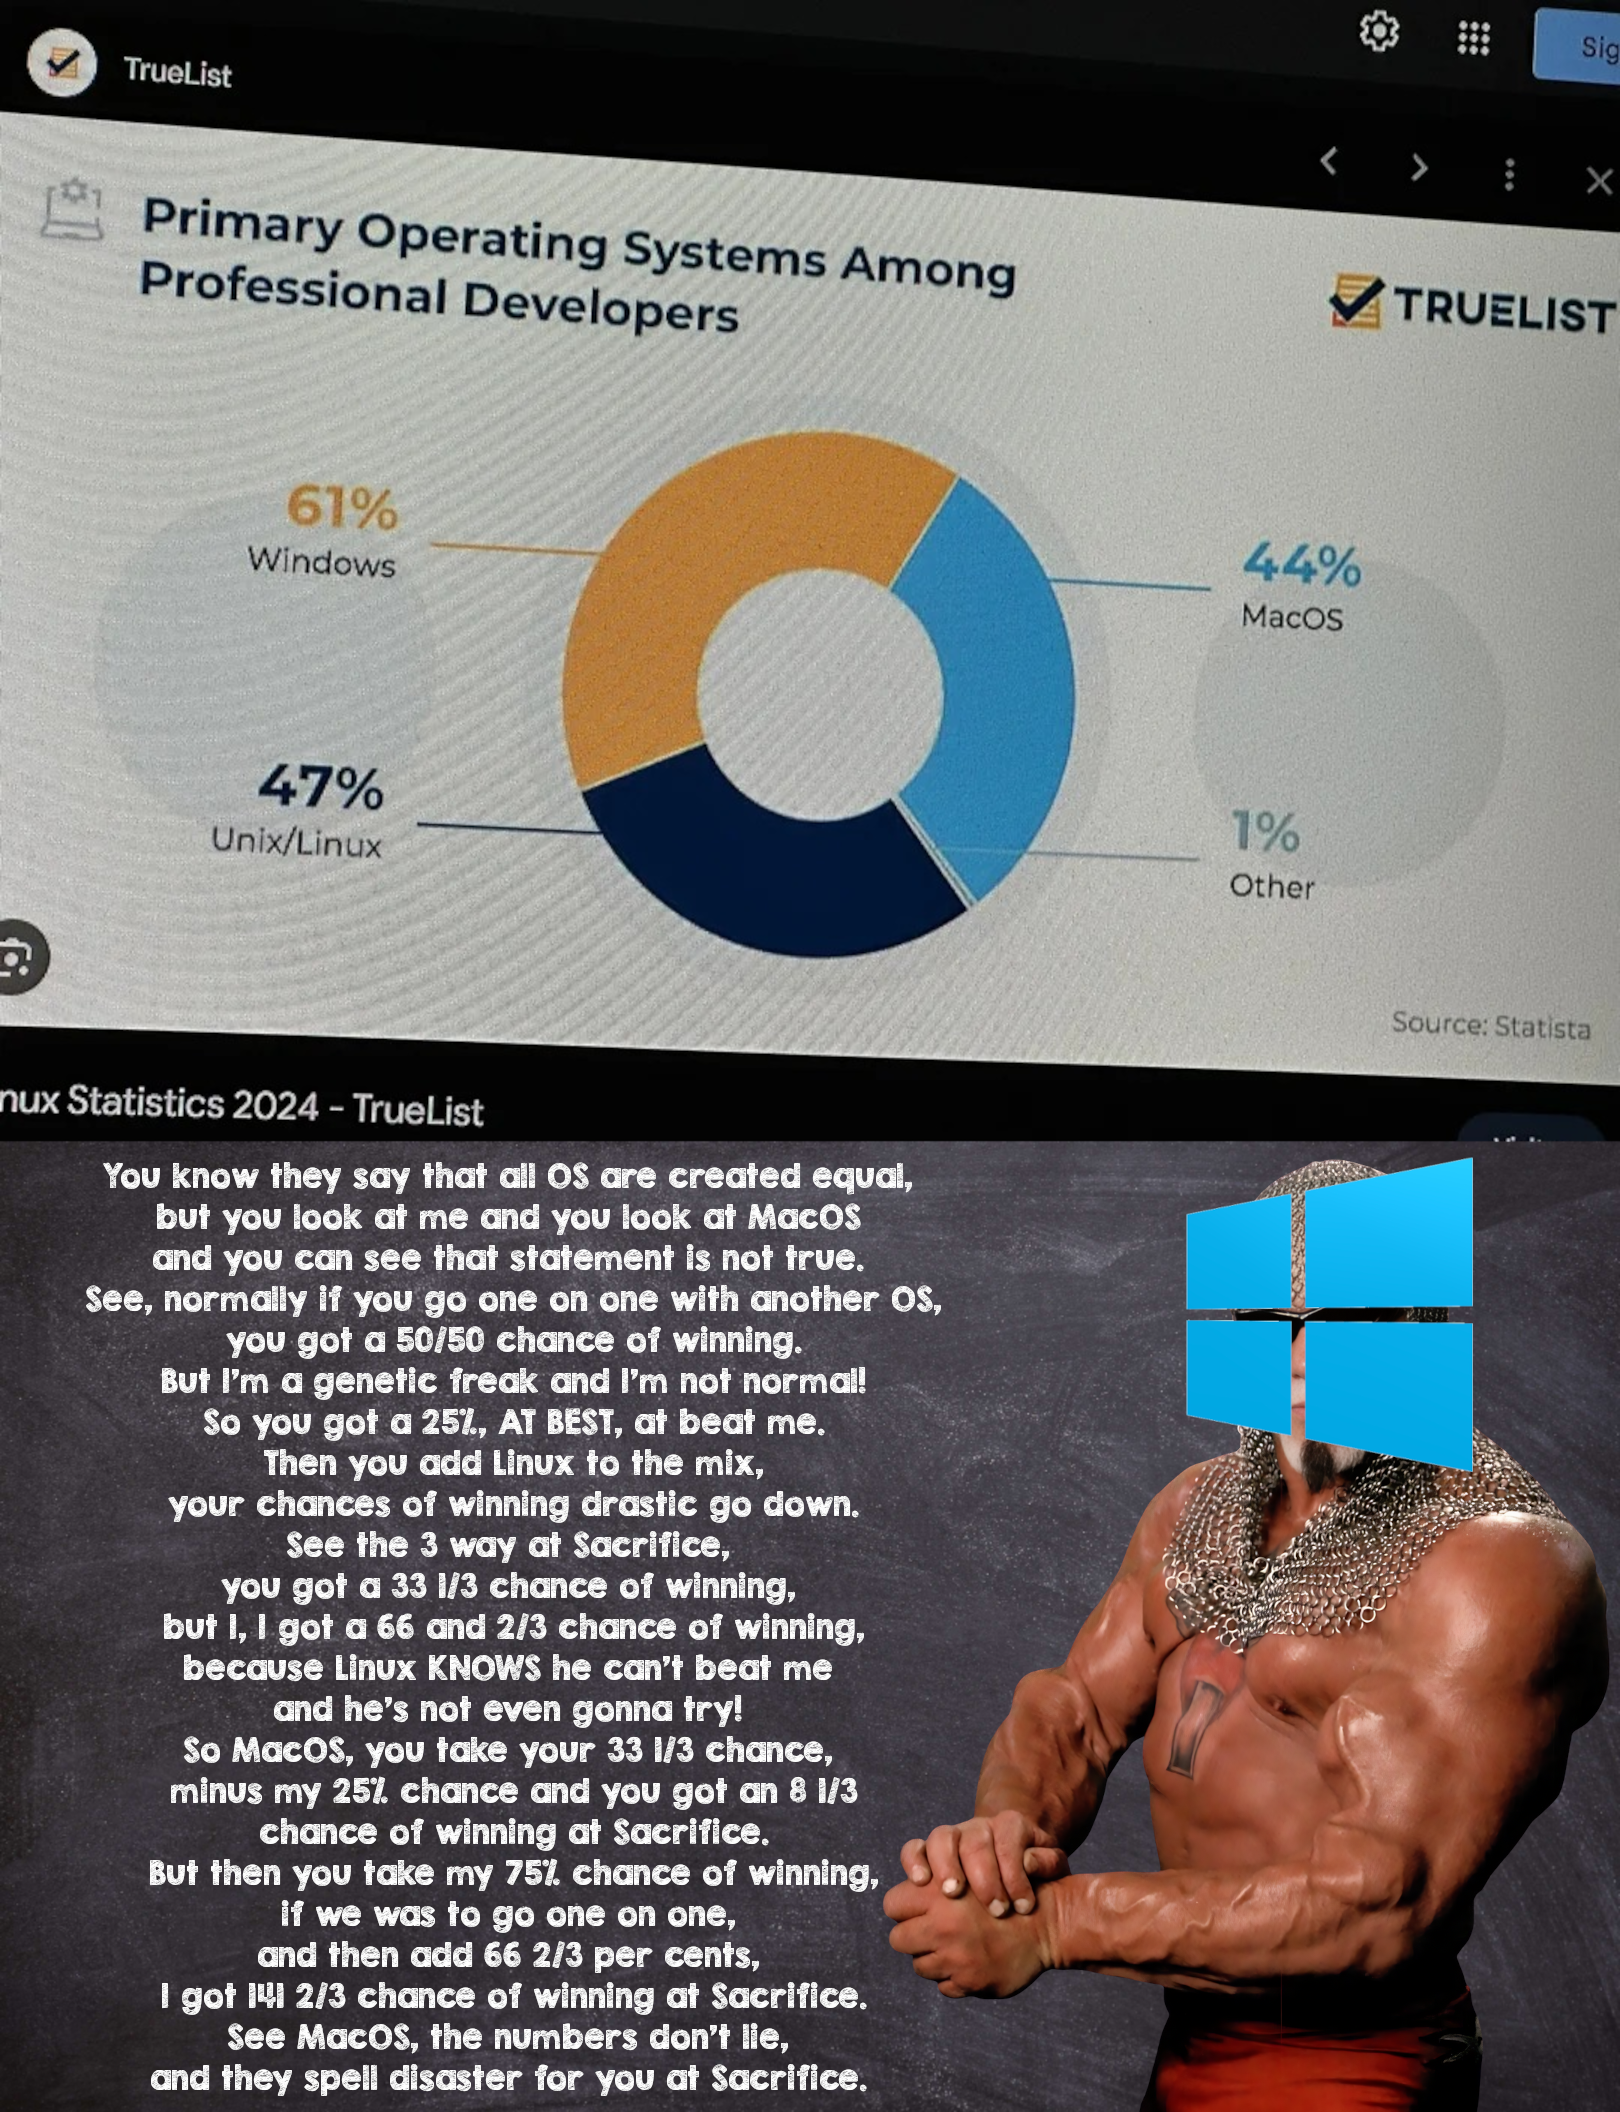
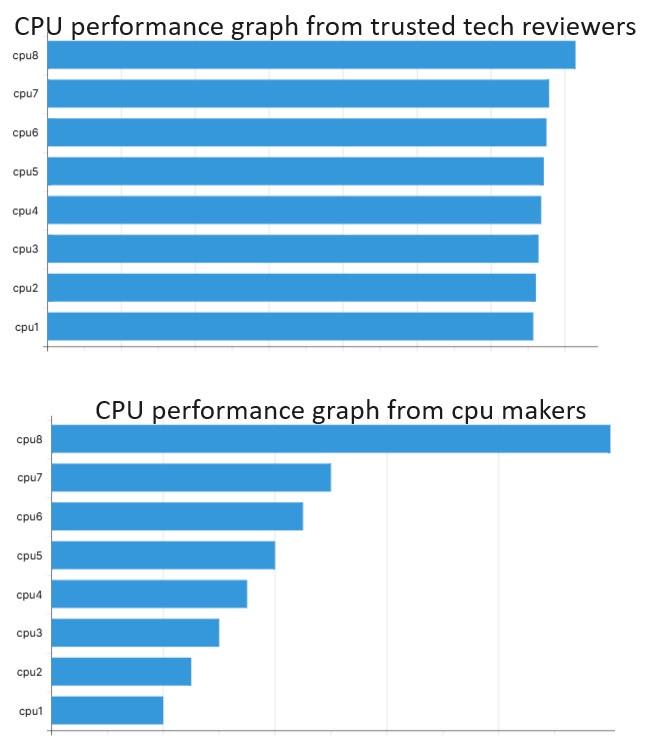
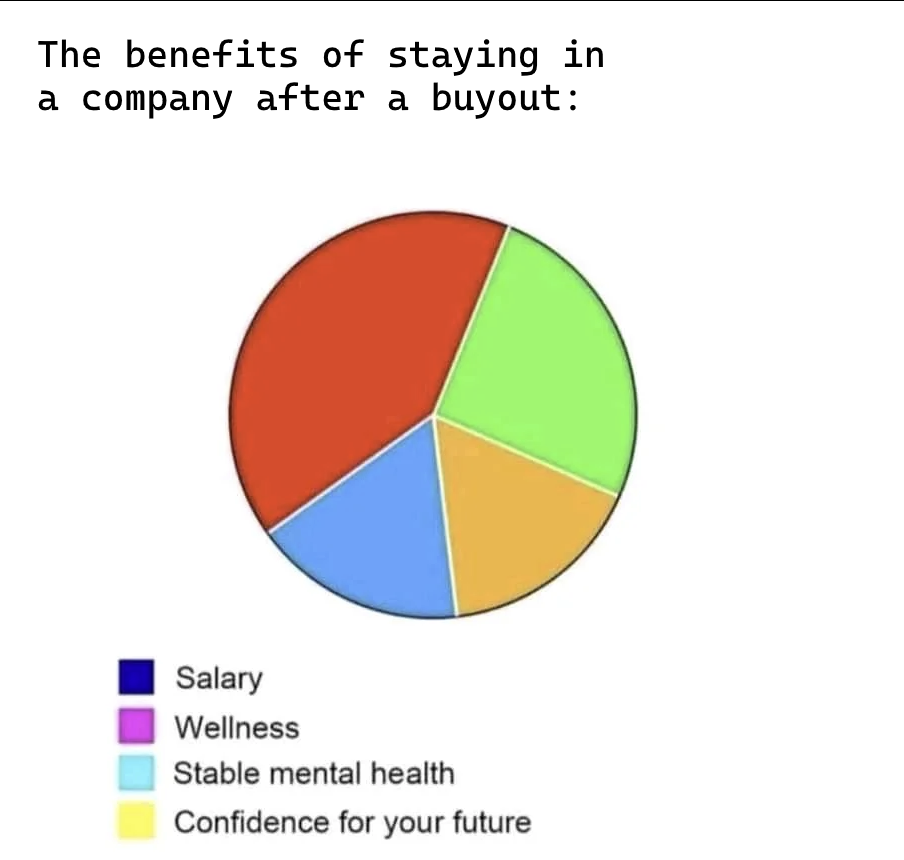
Data visualization Memes

Posts tagged with Data visualization

Triple Axis Of Statistical Failure

Triple Axis Of Statistical Failure
The chart itself is a masterclass in irony—a completely broken visualization about chart accuracy. Notice how the x-axis and y-axis don't even make sense together? That's the joke swallowing its own tail. Apparently, coding your visualization gives you a 74.9% chance of success if you think (but only 52.8% if you don't bother with that pesky thinking process). Meanwhile, GUI tools clock in at 69.1%, and "vibe charting"—that scientific approach where you just go with whatever looks pretty—nets you a solid 30.8%. The supreme irony? This chart about chart accuracy is itself a statistical abomination. Different categories on the x-axis, percentages that don't relate to each other, and a complete disregard for data visualization principles. It's like watching someone give a PowerPoint presentation about public speaking while tripping over their own shoelaces.

That's Not How Percentages Work

That's Not How Percentages Work
Ah, the classic "math doesn't matter" approach to OS statistics! This chart showing Windows at 61%, Linux at 47%, macOS at 44%, and "Other" at 1% adds up to a beautiful 153%. It's paired with a WWE-style Scott Steiner math promo where he butchers probability calculations with the confidence of a junior dev pushing to production on Friday afternoon. The real joke? This is exactly how most tech companies present their market dominance - counting every installation twice and rounding up to the nearest "whatever makes us look good." Who needs mathematical consistency when you've got marketing goals to hit?

K-Means Be Like: Manual Clustering Nightmare

K-Means Be Like: Manual Clustering Nightmare
OH MY GODDD! This is LITERALLY k-means clustering in its purest form! Those poor souls are manually separating colored balls into distinct clusters like some twisted data science ritual! The algorithm in real life is just as chaotic - throwing random centroids around and then frantically shuffling points between groups until everything looks "good enough." The absolute DRAMA of unsupervised learning, where you're just desperately hoping your arbitrary number of clusters makes sense! And don't even get me started on how this perfectly captures the "elbow method" failing spectacularly when you realize you picked the wrong k value and now your entire analysis is a technicolor disaster!

Bell Curves About Bell Curves

Bell Curves About Bell Curves
The ultimate statistical irony: a bell curve meme about bell curves that perfectly follows... a bell curve. You've got the low-IQ folks who think bell curves are funny because "haha, pretty graph go brrr," the high-IQ intellectuals who appreciate bell curves for the exact same reason, and the middle-of-the-curve galaxy brains screaming "BAN BELL CURVES!!1!" with the intensity of someone who just discovered their entire codebase uses tabs instead of spaces. The distribution of opinions about bell curves literally forms a bell curve, and that's the kind of recursive humor that keeps me going through sprint planning meetings.

Understanding Graph Axis Is Important

Understanding Graph Axis Is Important
Ah, the classic tale of two graphs! The top one from "trusted tech reviewers" shows all CPUs performing nearly identically - because they've zoomed in so much on a tiny performance difference that everything looks the same. Meanwhile, the CPU makers' graph looks like CPU8 is performing interstellar travel while CPU1 is struggling to cross the street. Same data, wildly different impression. It's the graphical equivalent of saying "technically I didn't lie" while completely misleading everyone. Next time your manager asks why your code isn't 500% faster than last sprint, just adjust your y-axis accordingly!

The Invisible Benefits Package

The Invisible Benefits Package
The punchline is literally invisible! That empty pie chart with no legend entries matching the colorful segments is the perfect representation of corporate buyout promises. You're looking at a graph where the colored sections (red, green, blue, yellow) don't correspond to any of the listed benefits (salary, wellness, mental health, confidence). It's like when management promises "synergy" and "exciting opportunities" but delivers... *gestures vaguely at nothing*. The technical term for this is "data visualization gore" and any engineer who's survived an acquisition knows exactly what those missing legend colors actually represent: anxiety, overtime, and updating your resume while pretending to be in a Zoom meeting.

Too Afraid To Ask About LLM Benchmarks

Too Afraid To Ask About LLM Benchmarks
The AI benchmarking cult strikes again! Everyone's obsessed with those radar charts comparing Large Language Models using some bizarre "ball turning test" metric that nobody actually understands. It's just a bunch of geometric shapes that supposedly prove one model is better than another. The joke here is that these comparison charts have become so ubiquitous in AI discussions that even though they're practically meaningless to most developers, everyone nods along pretending to understand what they're looking at. Classic tech impostor syndrome - nobody wants to be the one to ask "what the heck does this actually measure?"

When Conditional Formatting Breaks Reality

When Conditional Formatting Breaks Reality
The perfect visualization of conditional formatting in spreadsheets. One snake sees a purple wall and insists it's pink, while the other swears it changes color when you blink. It's exactly like when you set up those Excel rules that make cells change color based on values, and then your coworker opens the file and goes "why is everything green?" Meanwhile, you're staring at a sea of red cells wondering if you're both looking at the same damn spreadsheet. The turtle is just QA, silently judging everyone's reality.