 AI
AI
 AWS
AWS
 Agile
Agile
 Algorithms
 Android
 Apple
Apple
 Azure
Azure
 Bash
Bash
 C++
C++
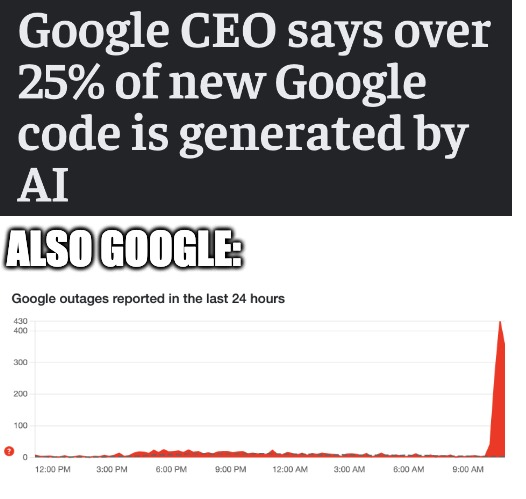
The duality of Google's AI strategy in its full glory! Upper text: "25% of new Google code is AI-generated." Lower graph: "Massive spike in Google outages."
That red spike isn't just a graph—it's the visualization of what happens when your AI autocompletes semicolons with emojis and replaces error handling with "try { } catch (e) { // TODO: fix later lol }".
Correlation doesn't imply causation... but that spike is suspiciously vertical right when the AI started writing production code. Coincidence? I think not!